We applied two different tests to 269 S&P 500 companies in fiscal year 2024. The board’s scorecard says 62% are aligned. The market’s scorecard says 76%. The 14-point gap reveals something most pay analyses miss: the stock market quietly corrects board decisions that go wrong.
Key Takeaways (FY2024 Data)
- Only 49.8%of S&P 500 companies pass both the board’s test and the market’s test for pay-performance alignment. 11.9%fail both — the strongest signal of a pay-performance disconnect.
- In 70 companies (26%), the board’s pay decision was misaligned with stock returns — but the equity-heavy compensation structure auto-corrected the outcome.
- 66 companies raised CEO pay while their stock fell. The most extreme: Sirius XM (+418%), Illumina (+216%), and Albemarle (+71%) — with stock declines ranging from 19 to 81 percentage points.
- Broadcom’s board cut CEO pay 98% (from $161.8M to $2.6M), but the stock doubled — making the CEO’s actual outcome $1.15 billion.
The two scorecards
Only half of S&P 500 CEOs pass both tests for pay-performance alignment. But which half depends entirely on how you measure — and the two standard approaches disagree by 14 percentage points.
The board’s scorecardis the Summary Compensation Table (SCT) — what the board approved at grant date. It measures intent: did the board set pay appropriately given performance?
The market’s scorecardis Compensation Actually Paid (CAP) — what the CEO actually realized after stock price changes adjusted the value of their equity. It measures outcome: did the CEO’s wealth track the shareholder’s experience?
When both agree, the signal is clear. When they disagree, it reveals something about how compensation design actually works.
Our database covers more than 500 S&P 500 companies and 6,600+ compensation reports. For this analysis, we narrowed to 269 companies with complete data for both scorecards (SCT and CAP) plus Total Shareholder Return (TSR) for fiscal years 2023 and 2024. We excluded companies with CEO transitions mid-year, missing CAP disclosures, or fiscal year mismatches that would prevent an apples-to-apples year-over-year comparison.
The test is directional: did pay move in the same direction as stock returns? This is deliberately simple — it captures the core question without introducing arbitrary thresholds. The trade-off: it doesn’t penalize magnitude mismatches (a CEO getting +200% pay for +2% stock returns would still count as “aligned”). We address that limitation in the methodology notes below.
The pay-performance matrix
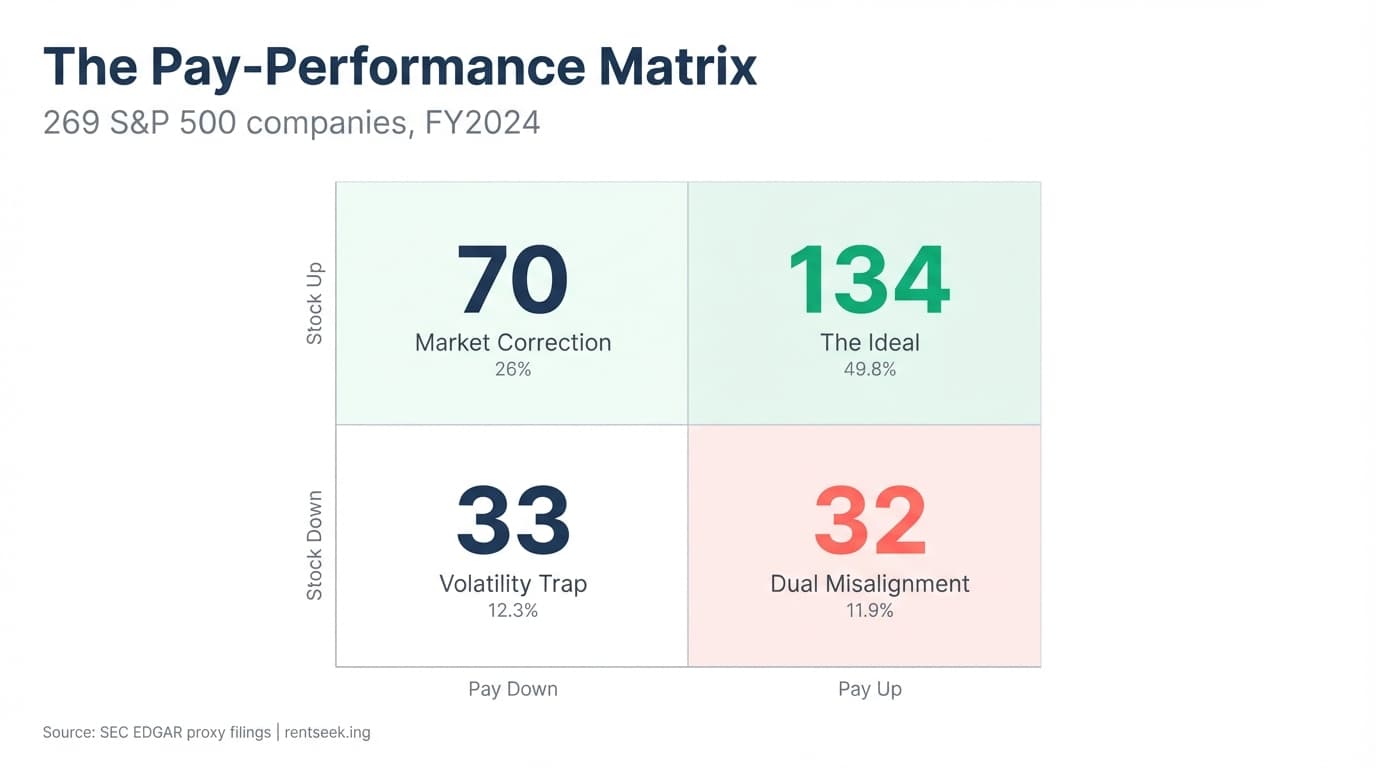
When you apply both scorecards to the same companies, four patterns emerge:
The Ideal — 134 companies (49.8%)
Board decision and market outcome both aligned with stock returns. Both scorecards agree: pay tracked performance.
The Market Correction — 70 companies (26.0%)
The board’s pay decision was misaligned — but the equity-heavy compensation structure auto-corrected the outcome. This is the circularity effect in action: because 60%+ of CEO pay is stock, the market adjusts realized pay even when the board gets it wrong.
Broadcom (AVGO)
The board slashed Hock Tan’s reported pay package. Then Broadcom’s stock ripped, and the market told a completely different story.
- Reported Pay
- $161.8M → $2.6M (-98%)
- Market Outcome (CAP)
- $767.7M → $1.15B
AppLovin (APP)
AppLovin’s board cut reported pay, but a huge rally overwhelmed that decision.
- Reported Pay
- $83.4M → $11.2M
- Stock Return
- +713%
- Market Outcome (CAP)
- $271M → $386M
The Volatility Trap — 33 companies (12.3%)
The board set pay appropriately, but stock price swings made the CAP number look misaligned. This is the false positive: good governance that looks bad because of market noise.
Amazon (AMZN)
Amazon’s board made a big new grant and the stock climbed, but CAP moved lower as prior-year gains unwound.
- Reported Pay
- $1.4M → $23.6M
- Stock Return
- +44%
- Market Outcome (CAP)
- $109.6M → $92.4M
Coinbase (COIN)
Coinbase raised reported pay into a strong year, but CAP still dropped as older mega-grants came back to earth.
- Reported Pay
- $4.7M → $7.2M
- Stock Return
- +43%
- Market Outcome (CAP)
- $680.9M → $523.6M
Dual Misalignment — 32 companies (11.9%)
Both scorecards say misaligned. The board’s decision was wrong and the market didn’t save them. This doesn’t prove bad governance on its own — boards may have valid multi-year reasons — but it’s the strongest red flag in the data and the bucket that warrants the closest scrutiny.
Booking Holdings (BKNG)
Shareholders had a strong year, but both board pay and market outcome moved in the wrong direction.
- Reported Pay
- $46.7M → $44.8M
- Stock Return
- +41%
- Market Outcome (CAP)
- $139.5M → $126.4M
Amkor Technology (AMKR)
At Amkor, both scorecards rose while the stock fell. That is the clearest pay-up, shares-down signal.
- Reported Pay
- $12.8M → $16.6M (+30%)
- Stock Return
- -21%
- Market Outcome (CAP)
- $9.7M → $14.2M
We break down CEO pay like this every week — one company, one filing, one story you won’t find on Bloomberg.
What the 14-point gap reveals
The gap between the two alignment rates — 75.8% (CAP) versus 62.1% (SCT) — isn’t a flaw in the data. It’s the compensation structure working as designed. To understand why, look at what CEO pay is actually made of.
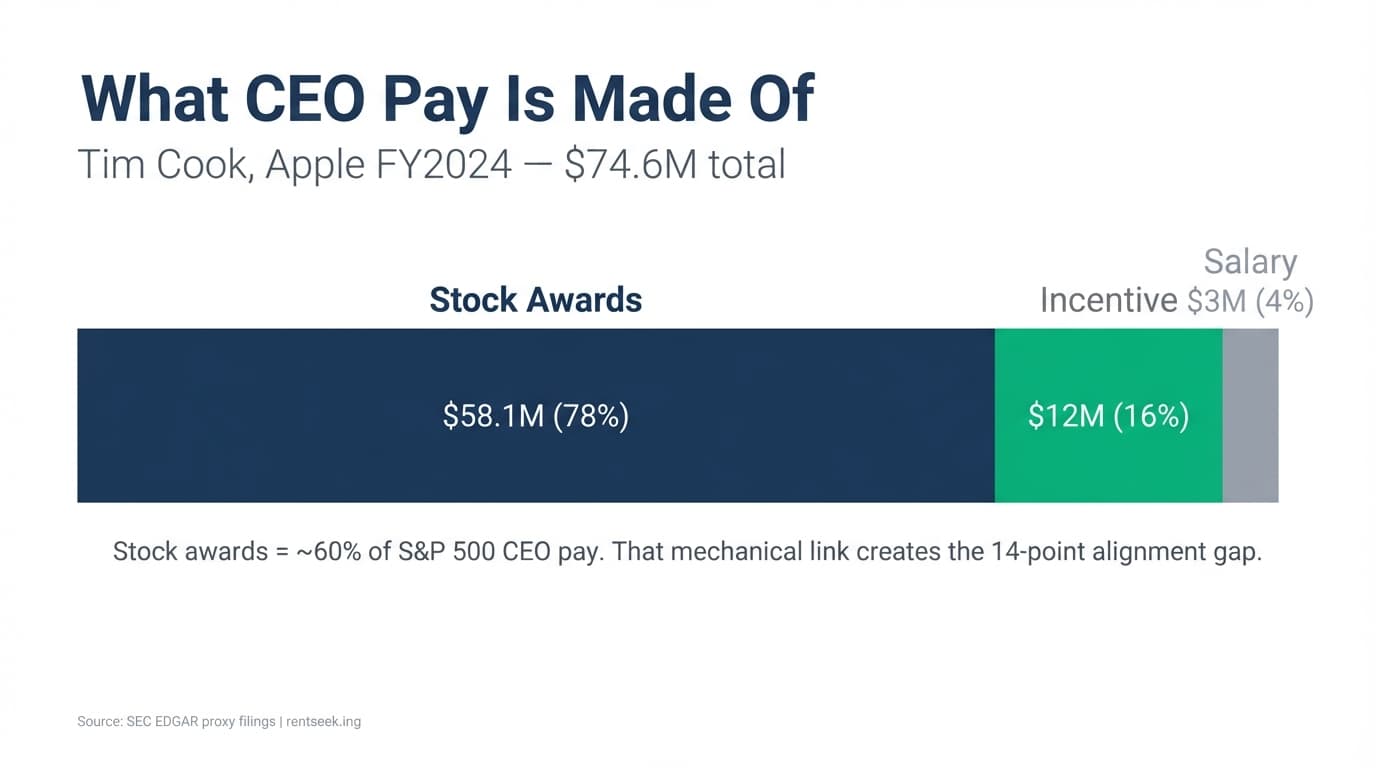
Stock awards do most of the work in CEO compensation. That is why market moves can reverse a board decision after the proxy is filed.
Tim Cook FY2024 Total
$74.6M
Stock Awards
$58.1M (78%)
Salary + Incentive
$15.0M (20%)
When the stock drops, the CEO’s realized wealth drops with it. That mechanical link is what creates the 14-point gap: equity-heavy pay auto-corrects 70 board decisions that would otherwise look misaligned.
The question is whether that mechanical correction is enough. In 32 companies — 11.9% of the sample — it wasn’t. Vesting schedules, one-time retention grants, and board discretion can all override the link. Those 32 are where governance matters most.
66 boards that raised pay while the stock fell
Using the board’s scorecard (SCT) alone — the test ISS applies to say-on-pay votes — 66 companies raised CEO reported compensation while their stock declined in FY2024. Below are four of the largest jumps.
| Company | Reported Pay | Stock Move |
|---|---|---|
| Sirius XM (SIRI) Jennifer Witz | $7.2M → $37.1M (+418%) | -48 pts |
| CoStar Group (CSGP) Andrew Florance | $29.2M → $37.4M (+28%) | -18% |
| Adobe (ADBE) Shantanu Narayen | $44.9M → $52.4M (+17%) | -16% |
| Moderna (MRNA) Stéphane Bancel | $15.2M → $17.9M (+18%) | -58% |
Context matters: boards may raise pay for retention, prior performance, or multi-year plan cycles. But the pattern is visible in the data and rarely discussed in proxy statements.
We score each company on these dimensions on every company page. See the full scoring methodology.
How governance professionals test this
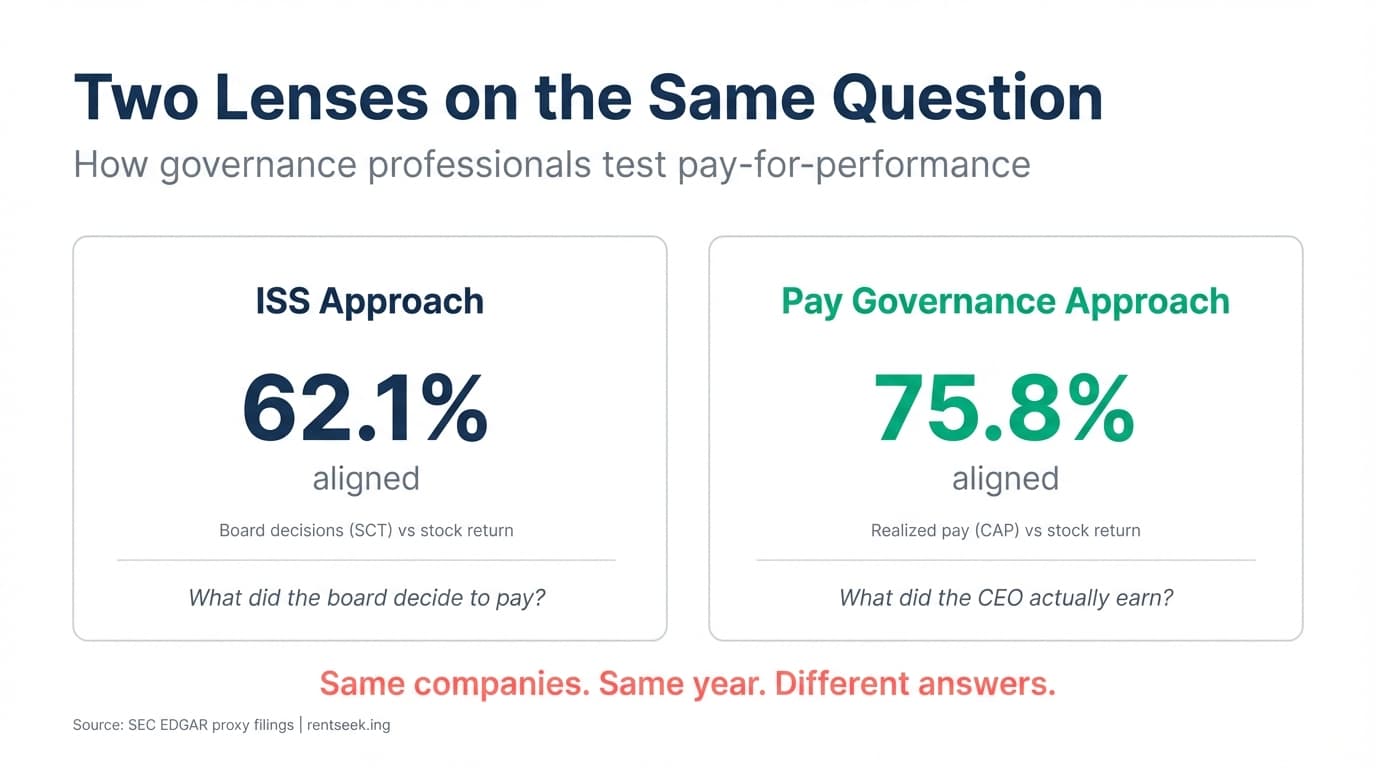
Professional frameworks formalize what we measured above. ISS uses the board’s scorecard; Pay Governance uses the market’s.
ISS (grant-date pay):Their Relative Degree of Alignment (RDA) compares a CEO’s pay rank against the company’s TSR rank within a peer group. Scores range from −100 to +100; S&P 500 flags fire at roughly −40 to −60. Their Multiple of Median (MoM) checks whether pay exceeds 2–3× the peer median. Both use grant-datevalues — what the board decided.
Pay Governance (outcome-based):Their “green zone” plots CAP rank against TSR rank and checks whether they fall within ±25 percentile points. Their research found a 0.56 correlation between CAP and TSR (versus just 0.08 for SCT). About 64% of S&P 500 companies land in the green zone. See the Harvard Law Forum on pay-for-performance alignment.
The bottom line
“Are CEOs paid for performance?” depends on which scorecard you read. The board’s scorecard says 62% aligned. The market’s says 76%. Only 49.8% pass both.
The 14-point gap exists because equity-heavy compensation is designed to auto-correct: when the stock falls, the CEO’s realized pay falls with it. That structure is doing its job in 70 companies that would otherwise look misaligned. But in 32 companies — 11.9% of the sample — neither the board nor the market delivered alignment. Those are the real governance failures.
The most useful approach isn’t to pick one scorecard. It’s to read both.
- If you’re a board member:Check whether your company lands in the “market correction” bucket. If equity is doing the alignment work, your pay design is resilient — but you should understand why.
- If you’re an investor:Focus on the “dual misalignment” bucket. Those 32 companies are where say-on-pay votes and engagement letters have the most leverage.
- If you’re a compensation consultant: The 14-point gap is a measurable argument for why CAP-based analysis supplements rather than replaces grant-date screens.
That’s what we build at rentseek.ing: the data and tools to evaluate any company’s pay practices yourself.
Frequently asked questions
What percentage of S&P 500 CEOs are actually paid for performance?
On a 269-company sample with comparable two-year data, only 49.8% of S&P 500 CEOs passed both the board's scorecard (did directors connect pay to disclosed performance metrics?) and the market's scorecard (did the stock move in the same direction as pay?). The 14-point gap between the two tests is where the market quietly corrects board decisions.
What are the two scorecards used in this analysis?
Scorecard 1 — the board's: did this year's bonus, equity vesting, and CEO total pay move in the same direction as the company's own disclosed performance metrics (revenue, operating income, the metrics the board chose to weight). Scorecard 2 — the market's: did CEO total pay move in the same direction as total shareholder return over the same year-over-year window.
Why does the gap between the two scorecards matter?
Boards control the design of executive pay; markets control the outcome shareholders actually experience. When a CEO passes the board's scorecard but fails the market's, the board's chosen metrics either lagged or never tracked stockholder return in the first place. That gap is the rentseek.ing dataset's clearest signal of pay-design failure.
Sources & Methodology
- Data:SEC EDGAR proxy filings (DEF 14A, 20-F) for 500+ S&P 500 companies. This analysis uses 269 companies with matched SCT, CAP, and TSR data for fiscal years 2023 and 2024, extracted via our deterministic pipeline.
- Alignment test:Directional — did pay move in the same direction as TSR, year over year? Applied separately using SCT (board decision) and CAP (market outcome). Companies are classified into four buckets based on agreement/disagreement between the two tests.
- Limitations:CAP is an SEC formula that includes unrealized equity value changes — it can be negative and does not equal cash received. CAP mechanically correlates with TSR because equity revaluation is driven by stock price; this partly explains the higher CAP alignment rate. SCT reflects grant-date fair values, not board “intent” in a pure sense. Our directional test does not account for magnitude: a CEO receiving +200% pay for +2% stock returns counts as “aligned.” One-year windows can misclassify long-cycle incentive plans; a rolling 3-year analysis (which we plan to publish) would reduce noise. TSR is one of many metrics boards use — ROIC, revenue, and strategic milestones also factor into pay decisions.
- Frameworks:ISS RDA and MoM (grant-date pay with ISS-revalued equity); Pay Governance ±25 percentile green zone (CAP-based). See Pay Governance (2024); Kay & Kesner (2025).
- Market data: Yahoo Finance (TSR, market capitalization).
269 companies. That’s this week.
Next week we pick apart a new batch of DEF 14A filings — mega-grants, say-on-pay red flags, and the boards nobody’s watching. One email, every Friday.